
Company Overview
The company is the seventh-largest, retail-focused non-banking financial company (NBFC) in India and is classified as an Upper Layer NBFC by the Reserve Bank of India. Established in 2007 as a subsidiary of HDFC Bank Limited, the company has evolved into a well-diversified lending institution with a wide portfolio of products tailored to a growing and varied customer base.
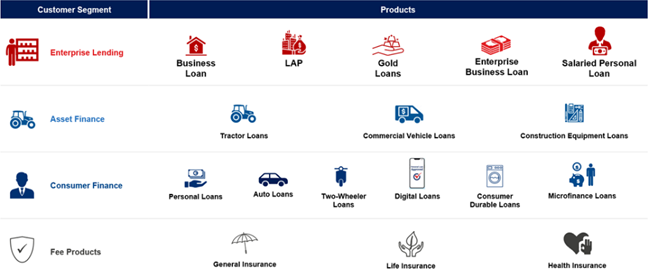
Its product suite spans secured and unsecured loans, including business loans, vehicle and equipment finance and consumer, digital, and lifestyle durable loans, catering to the personal and income-generating needs of customers.
Pan-India Presence
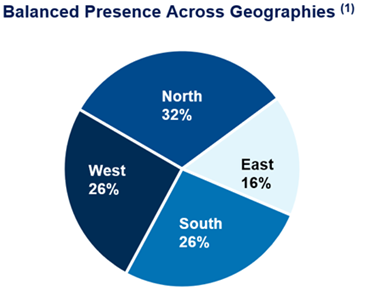
As of March 31, 2025, the company had established a pan-India footprint with 1,771 branches across 1,170 towns and cities in 31 States and Union Territories, with over 80% of its branches located outside India's 20 largest cities. This deep geographic reach is complemented by robust digital capabilities, which enhance operational efficiency and customer experience.
Customer Base
The company primarily serves underserved and underbanked segments of the Indian population, focusing on low- to middle-income households with minimal or no prior credit history. Its customer base comprises salaried individuals, self-employed professionals, business owners, and entrepreneurs. As of March 31, 2025, 11.57% of the total gross loans were extended to “new-to-credit” customers, reflecting the company’s commitment to financial inclusion.
Customer concentration risk remains low, with the top 20 customers contributing less than 0.34% of the total gross loan book as of the same date. Lending operations are structured across three key verticals: Enterprise Lending, Asset Finance, and Consumer Finance, enabling the company to serve a broad spectrum of financing needs.
Credit Profile
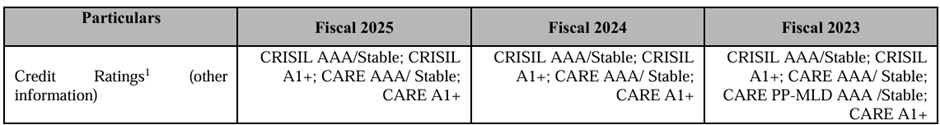
The company’s strong credit profile is supported by a diversified liability franchise and AAA (Stable) credit ratings from CRISIL and CARE—the highest rating achievable for an NBFC in India. This enables access to funding at competitive interest rates and flexible tenors, across both fixed and floating-rate instruments. As of March 31, 2025, the company’s average cost of borrowings stood at 7.90%.
With a strong credit profile, expansive distribution network, and a digitally driven operating model, the company is well-positioned to drive sustainable growth and expand financial access across India’s underserved markets.


Delete Comment?
Are you sure you want to delete this comment? This action cannot be undone.
Discussion
Join the discussion!
Log In to CommentNo comments yet. Be the first to share your thoughts!