
Varmora Granito
1. Overview
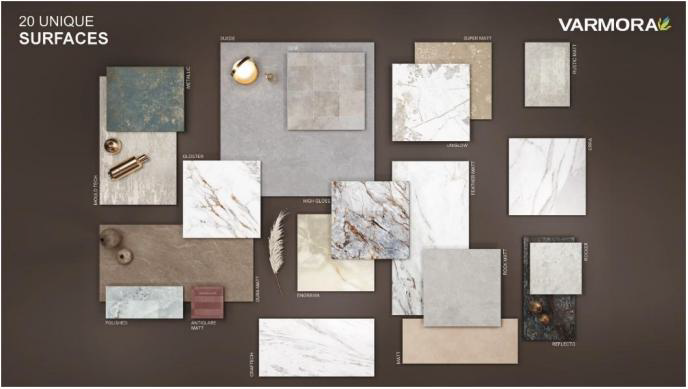
Varmora Granito Limited is a tiles-led building materials manufacturer operating in the Indian tiles, bathware and adhesives sector. Incorporated on November 18, 2003 as a private limited company in Gujarat, the company converted into a public company in 2025. Its product range spans glazed vitrified tiles (GVT), polished vitrified tiles (PVT) and ceramic tiles, with a strategic tilt toward premium GVT and technical products. It was the first company in Asia to commercialise SACMI's integrated stone technology (IST) in 2024, producing marble-like slabs with body veins.
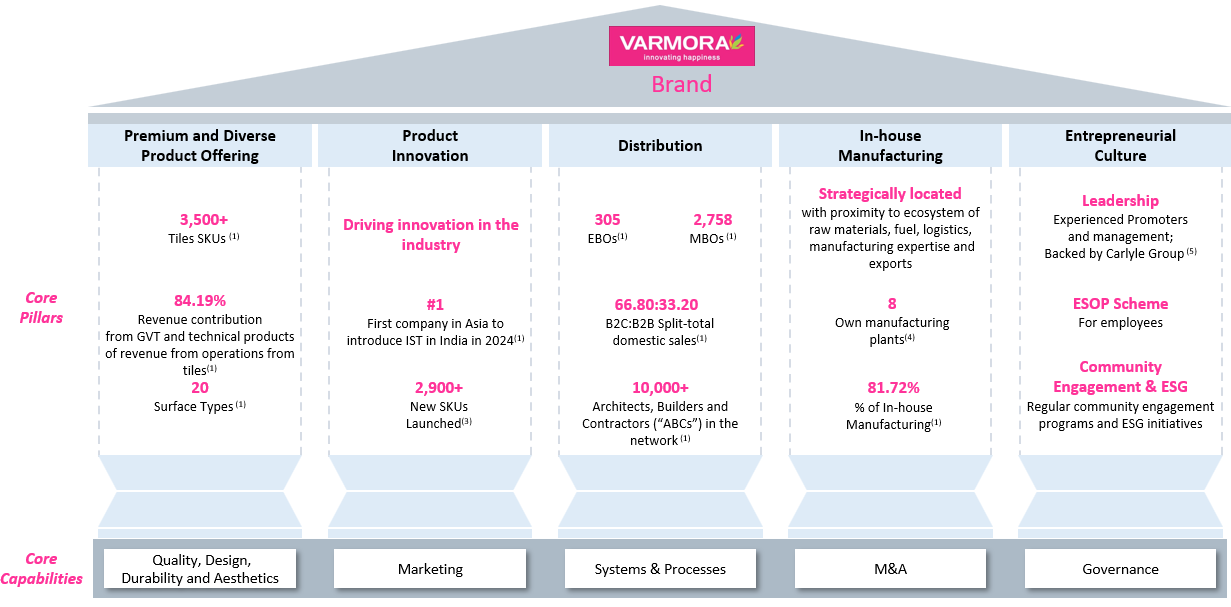
On scale, the company reported Revenue from Operations of ₹1,512.46 Crore in Fiscal 2026, sold 38.34 million sq. m. of tiles and carried a portfolio of 4,289 tile SKUs across 20 surface types. GVT and technical products formed 84.19% of tile revenue — per the Technopak Report, the highest GVT share among selected listed peers. The company holds an estimated ~6.6% share of the Indian GVT market by revenue and ranks among the top four players in the Indian tiles market by revenue among selected listed peers.
Its manufacturing footprint is concentrated in the Morbi cluster, Gujarat, where it operates eight in-house facilities (through the company and subsidiaries). 81.72% of revenue came from in-house manufactured products in Fiscal 2026, and third-party contract manufacturers produce lower-complexity ceramic and PVT tiles. In July 2026, the Allemby Ceramics joint venture began operating a 6.40 million sq. m. p.a. GVT plant in Tezpur, Assam, which is the company's first capacity outside Gujarat.
Distribution is pan-India and export-oriented. The network comprises 305 EBOs and 2,758 MBOs across 988 cities in 24 states/UTs, plus B2B project and government channels. Products have been exported to 100+ countries since inception. The company is backed by Katsura Investments (a Carlyle Group affiliate), which invested ₹640.35 Crore in Fiscal 2023.
2. Business Model and Revenue Streams
2.1 Revenue by Product Segment (₹ Cr)
| Segment | FY26 | % | FY25 | % | FY24 | % |
|---|---|---|---|---|---|---|
| GVT & Technical Products | 1,118.98 | 73.98% | 1,005.84 | 69.56% | 940.89 | 65.54% |
| PVT | 128.79 | 8.52% | 156.04 | 10.79% | 182.03 | 12.68% |
| Ceramics | 81.29 | 5.37% | 116.05 | 8.03% | 125.49 | 8.74% |
| Total – Tiles | 1,329.06 | 87.87% | 1,277.93 | 88.38% | 1,248.40 | 86.96% |
| Bathware | 138.80 | 9.18% | 128.76 | 8.90% | 143.28 | 9.98% |
| Adhesives | 22.73 | 1.50% | 20.93 | 1.45% | 20.38 | 1.42% |
| Others* | 21.88 | 1.45% | 18.41 | 1.27% | 23.42 | 1.63% |
| Revenue from Operations | 1,512.46 | 100.00% | 1,446.03 | 100.00% | 1,435.48 | 100.00% |
*Broken tiles and samples, dealer display revenue, insurance facilitation charges and export incentives.
Premiumisation is the dominant trend. GVT & technical products rose by ~8.4 percentage points of RFO over two years, while PVT and Ceramics declined in absolute terms.
All new product launches in FY24–FY26 (100% of new-launch sales) were GVT and technical products.
Revenue CAGR (FY24–FY26): 2.65%, which is modest. Mix improvement, rather than volume, drove the gross margin gain from 35.26% to 37.92%.
2.2 Revenue by Channel and Geography
| Channel (₹ Cr) | FY26 | % | FY25 | % | FY24 | % |
|---|---|---|---|---|---|---|
| EBO (domestic tiles) | 282.26 | 18.66% | 263.12 | 18.20% | 226.90 | 15.81% |
| MBO (domestic tiles) | 736.07 | 48.67% | 713.09 | 49.31% | 684.18 | 47.66% |
| Total domestic tiles | 1,018.33 | 67.33% | 976.22 | 67.51% | 911.08 | 63.47% |
| Bathware | 138.80 | 9.18% | 128.76 | 8.90% | 143.28 | 9.98% |
| Adhesives | 22.73 | 1.50% | 20.93 | 1.45% | 20.38 | 1.42% |
| Others | 21.88 | 1.45% | 18.41 | 1.27% | 23.42 | 1.63% |
| Export tiles | 310.73 | 20.54% | 301.72 | 20.87% | 337.32 | 23.50% |
| Revenue from Operations | 1,512.46 | 100.00% | 1,446.03 | 100.00% | 1,435.48 | 100.00% |
| B2C vs B2B (Domestic Sales, ₹ Cr) | FY26 | % | FY25 | % | FY24 | % |
|---|---|---|---|---|---|---|
| B2C (EBO + MBO) | 791.56 | 66.80% | 776.73 | 68.82% | 820.47 | 75.96% |
| B2B (builders, contractors, govt.) | 393.45 | 33.20% | 351.90 | 31.18% | 259.60 | 24.04% |
| Total Domestic Sales | 1,185.01 | 100.00% | 1,128.64 | 100.00% | 1,080.07 | 100.00% |
| City Tier (₹ Cr) | FY26 | % | FY25 | % | FY24 | % |
|---|---|---|---|---|---|---|
| Metro | 96.75 | 6.40% | 92.50 | 6.40% | 90.77 | 6.32% |
| Tier I | 226.79 | 14.99% | 179.39 | 12.41% | 153.03 | 10.66% |
| Tier II | 861.47 | 56.96% | 852.08 | 58.93% | 827.21 | 57.63% |
| Exports | 317.09 | 20.97% | 305.63 | 21.14% | 341.32 | 23.78% |
| Others | 10.37 | 0.69% | 16.44 | 1.14% | 23.15 | 1.61% |
B2B is the fastest-growing channel. Its share of domestic sales rose from 24.04% to 33.20% in two years, with 1,411 builders/contractors serviced as of March 31, 2026 (FY24: 1,154).
Exports have not grown. They fell from ₹337.32 Crore (FY24) to ₹310.73 Crore (FY26), and their share of RFO declined by roughly 3 percentage points.
Tier II dependence: ~57% of RFO comes from Tier II cities. Tier I is the fastest-growing tier, up from 10.66% to 14.99%.
Geographic diversification: no single Indian state contributed more than 14% of RFO in any of FY24–FY26.
2.3 Pricing and Contract Model
- B2C: EBOs and MBOs are run on a franchisee-owned, franchisee-operated (FOFO) model. Franchisees bear the outlet capex and staffing, and the company provides incentives, display support and in-house setup teams.
- B2B: Builders and contractors are served on a purchase-order basis, usually one order per project. Government demand comes through departmental empanelment, and products are procured by government contractors and agencies.
- Pricing philosophy: the company states that it prioritises durability and quality over aggressive pricing.
- Licensing income: the company receives an 8% royalty on Allemby's sales of goods that carry its licensed trademarks (three-year agreement, auto-renewing).
2.4 Client and Dealer Concentration
| Concentration (₹ Cr) | FY26 | % | FY25 | % | FY24 | % |
|---|---|---|---|---|---|---|
| Top 10 MBOs | 120.32 | 7.90% | 104.76 | 7.24% | 96.13 | 6.70% |
| Top 10 EBOs | 86.35 | 5.67% | 84.16 | 5.82% | 70.21 | 4.89% |
Dealer concentration is low but rising. The top 10 MBOs plus top 10 EBOs contributed ~13.6% of RFO in FY26, up from ~11.6% in FY24.
Key builder relationships:
- Signature Global (India) Limited: 9+ years; 1.5 million sq. m. purchased in FY25.
- Srijan Group: 15+ years.
- NCC Urban: 5+ years.
- Sobha Ltd.
2.5 Industry-Specific Operating Metrics
| Metric | FY26 | FY25 | FY24 |
|---|---|---|---|
| Tiles sales volume (million sq. m.) | 38.34 | 38.10 | 36.12 |
| Tile realisation (₹ per sq. m.) | 352.26 | 340.38 | 352.67 |
| Total dealer network (EBO + MBO) | 3,063 | 3,005 | 3,315 |
| Number of EBOs | 305 | 286 | 256 |
| Cities with EBOs | 249 | 232 | 209 |
| Revenue from in-house manufacturing (₹ Cr) | 1,235.93 | 1,135.85 | 959.35 |
| In-house manufacturing share of RFO | 81.72% | 78.55% | 66.83% |
| Gross Margin | 37.92% | 38.95% | 35.26% |
| EBITDA (₹ Cr) | 221.56 | 198.29 | 150.33 |
| EBITDA Margin | 14.18% | 13.28% | 10.21% |
| Profit for the year (₹ Cr) | 55.09 | 30.77 | 44.94 |
| ROCE | 9.89% | 6.32% | 7.95% |
| ROE | 6.80% | 4.14% | 6.39% |
| Net working capital days | 96 | 112 | 82 |
| Net debt (₹ Cr) | 243.43 | 390.01 | 314.57 |
| Advertisement & promotion (₹ Cr) | 23.16 | 33.24 | 37.56 |
| Capital expenditure (₹ Cr) | 33.76 | 111.67 | 348.30 |
Volumes have stagnated. Tile volume grew only ~0.6% in FY26, and realisation per sq. m. is broadly flat over three years (₹352.67 → ₹352.26).
The EBO model is far more productive. Average revenue per EBO was ₹0.93 Crore in FY26, versus ₹0.27 Crore per MBO. 136 MBOs were converted to EBOs between April 2023 and March 2026.
The capex cycle has peaked. Capex fell from ₹348.30 Crore (FY24) to ₹33.76 Crore (FY26) after two new Morbi facilities were commissioned. Net debt came down to ₹243.43 Crore.
Working capital intensity is high. NWC days rose to 112 in FY25 before easing to 96 in FY26.
3. Products and Service Portfolio
3.1 Tiles (87.87% of RFO)
GVT & Technical Products (₹1,118.98 Crore; 73.98% of RFO)
- This is the core revenue driver. GVT is glazed, stain-resistant, low-maintenance and needs no regular polishing.
- Pricing power: per the Technopak Report, GVT realises 15–30% more than ceramic and PVT tiles.
- Industry share of GVT: 28.5% (FY19) → 36.5% (FY26) → 45.5% (FY30E) of Indian tile industry revenue.
- Capacity focus: all capacity additions since 2011 have been dedicated to GVT.
Technical products / IST
- These are advanced vitrified surfaces made with specialised homogeneous body formulations, chips, grits and feeder technology. Commercial operations began in Fiscal 2026.
- IST is produced only at Varmora Unit – 2 (Morbi). Installed capacity is 3.96 million sq. m., with 58.59% utilisation in FY26.
- IST products are positioned as marble and granite substitutes, available across four surfaces.
PVT (₹128.79 Crore; 8.52%) and Ceramics (₹81.29 Crore; 5.37%)
- These are legacy, declining segments. They are high-volume, low-complexity products and are largely outsourced to contract manufacturers.
3.2 Adjacent Categories (12.13% of RFO)
- Bathware (₹138.80 Crore; 9.18%): revenue is flat versus FY24 (₹143.28 Crore).
- Adhesives (₹22.73 Crore; 1.50%): a small but steadily growing line (₹20.38 Crore → ₹22.73 Crore).
- Others (₹21.88 Crore): broken tiles and samples, dealer display revenue, insurance facilitation charges and export incentives.
3.3 Portfolio Depth and Innovation
| Portfolio Metric | Value |
|---|---|
| Total tile SKUs (Mar-26 / Mar-25 / Mar-24) | 4,289 / 4,177 / 4,009 |
| New tile SKUs launched (Apr-23 to Mar-26) | 2,900+ |
| Surface types | 20 (flooring, walls, back-paneling, façade, kitchen slabs) |
| New surface finishes launched (Apr-23 to Mar-26) | 8 |
| R&D team | 17 members |
| In-house designers | 20 |
| SKUs launched at Udaipur event (Jul-26) | 750+ |
3.4 Manufacturing Capacity
| Capacity Data | Value |
|---|---|
| In-house facilities (Morbi, Gujarat) | 8 |
| Capacity added in FY24 (two new facilities) | 17.76 million sq. m. (40.55% of total installed capacity as of Mar-26) |
| Share of installed capacity set up in the last 10 years | 74.65% (four of eight facilities) |
| Varmora Unit – 2 (IST) installed capacity / utilisation, FY26 | 3.96 million sq. m. / 58.59% |
| Allemby JV, Tezpur, Assam (commenced Jul-26) | 6.40 million sq. m. p.a. GVT; estimated project cost ₹149.97 Crore |
| Third-party contract manufacturers | Share of RFO: 17.60% (FY26) vs 32.19% (FY24) |
| Renewable capacity | 16.22 MW (wind 8.10 MW + solar 8.12 MW); 32.84% of FY26 electricity from renewable sources |
Implied total installed capacity: ~43.8 million sq. m. This is derived from 17.76 million sq. m. being 40.55% of the total. Company-wide utilisation is not disclosed in the pages reviewed.
Fuel flexibility: the plants can run on both propane and natural gas. Machinery is imported from Italy, and the facilities are ISO-certified.
Allemby stake: 50.00%, acquired for an aggregate ₹25.00 Crore. The company holds a call option exercisable after a three-year lock-in and a right to acquire up to a further 1%.
4. Key Business Strengths
- Premium mix leadership: GVT & technical products account for 84.19% of tile revenue, the highest among selected listed peers, and have lifted gross margin to 37.92%.
- Technology first-mover: the company was the first in Asia to commercialise SACMI's IST, opening access to the natural stone replacement market.
- Rapid SKU refresh: 2,900+ new SKUs were launched in three years, backed by a 17-member R&D team and 20 designers.
- Deep FOFO retail network: 305 EBOs + 2,758 MBOs across 988 cities, with no state above 14% of revenue.
- EBO productivity advantage: average EBO revenue of ₹0.93 Crore is ~3.5x the ₹0.27 Crore MBO average, and 136 conversions have been completed so far.
- Growing B2B franchise: B2B share of domestic sales rose from 24.04% to 33.20%, supported by 1,411 builders and government empanelment.
- Vertical control: 81.72% of RFO comes from in-house manufacturing, up from 66.83%, which strengthens quality control and margins.
- Cluster economics: the Morbi base gives proximity to Rajasthan clay and feldspar and to Mundra and Kandla ports.
- Recent capacity with headroom: 74.65% of capacity is less than 10 years old, and sites have vacant land for brownfield expansion.
- Institutional governance: Carlyle affiliate Katsura Investments is a shareholder, the board includes independent directors, and there are eight board committees plus third-party ESG assurance.
- Brand investment track record: the company has run TV, cinema and digital campaigns since January 2023, with 16 billion+ views, 50 channels and 4,000+ cinema screens.
5. Future Growth Strategy
- Core market consolidation (West and North): convert MBOs to EBOs, add new surfaces and build marble-dealer channels for IST products.
- Emerging market expansion (South and East): open new EBOs and MBOs and scale sales teams from a low base of 39 EBOs in the East and Northeast, versus 204 in the North and West.
- Northeast manufacturing base: ramp up the 6.40 million sq. m. Tezpur JV to cut lead times and logistics costs, and use it to capture the East India tiles market. That market is projected at ₹10,710 Crore by FY30 (9.6% CAGR).
- EBO-led distribution upgrade: use the 2,758 MBOs as a conversion pipeline and open larger-format EBOs in Tier II and III cities.
- IST as a marble and granite substitute: target the Indian natural stone market (₹42,340 Crore, FY26) and the façade market (₹27,080 Crore → ₹35,500 Crore by FY30).
- Bathware and adhesives scale-up: cross-sell through the EBO network into the sanitaryware and bathware market (₹35,700 Crore FY26 → ₹52,200 Crore FY30; ~10% CAGR).
- Inorganic brownfield acquisitions: target branded players with strong SKU leadership and southern or eastern distribution, as well as bathware and adhesive businesses.
- Brand building: keep a balanced ATL, BTL and digital mix, with airport and high-traffic outdoor touchpoints and an ABC loyalty programme.
- Digital and supply chain efficiency: expand sales force automation, upgrade the ERP, digitise design-to-delivery and improve warehousing and logistics.
- ESG: raise the renewable energy share and add 3.50 MW of solar at the Tezpur JV facility.







































Delete Comment?
Are you sure you want to delete this comment? This action cannot be undone.
Discussion
Join the discussion!
Log In to CommentNo comments yet. Be the first to share your thoughts!