Index
Index
IPO Analysis · Part 2 of 13
Priya, a fictional investor used here for illustration, is about to bid ₹1.5 lakh in an IPO whose headline reads "profit up 40%". She opens the RHP, sees hundreds of pages, and nearly closes it. The answer, however, sits in about a dozen pages of tables, and the three statements inside them either confirm the headline or quietly contradict it. This guide shows the order in which to read them.
Practical Tips
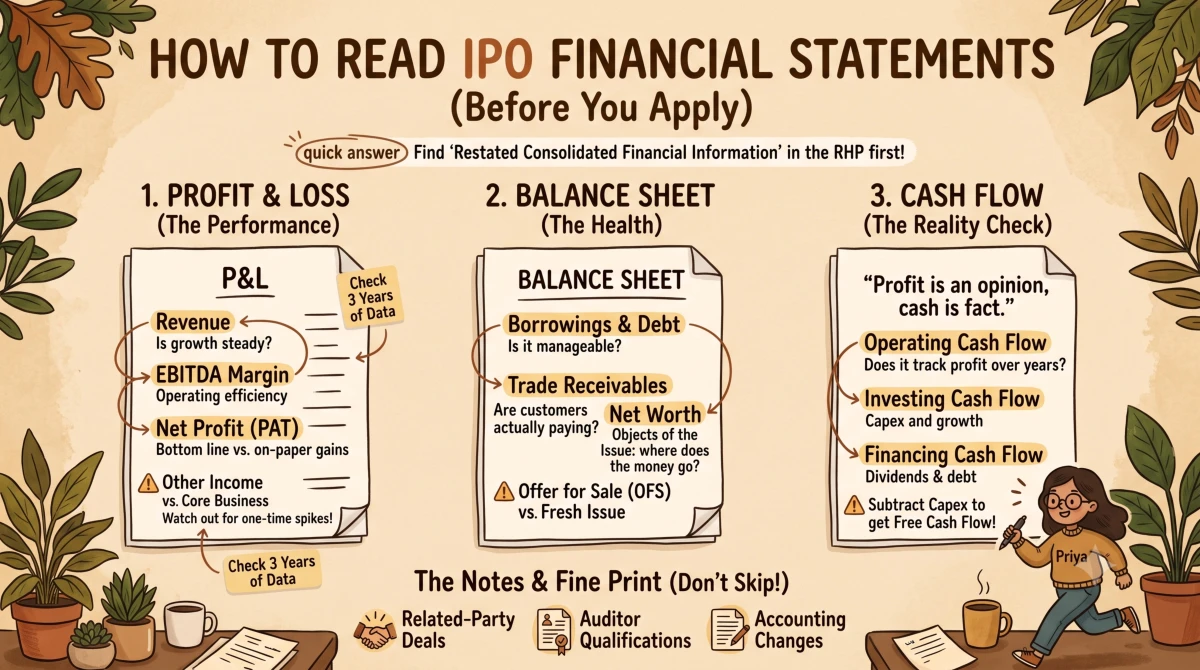
Step 1: Find the Restated Financial Information
Under SEBI's ICDR rules, an issuer discloses restated consolidated financials for the last three financial years, plus a stub period if the latest year-end is stale. "Restated" means the numbers were re-audited and adjusted for accounting policy changes, prior-period errors and regroupings, so that all years are comparable on one basis. That makes the restated figures more reliable than any annual report you may have seen earlier.
Start with the "Summary of Financial Information" near the front of the RHP, then move to the full statements and the auditor's examination report later in the document. If you are unsure where to download the document itself, our guide on where to find DRHP and RHP files covers it.
Step 2: Profit and Loss — Growth, Margins, Quality
Check four lines. Revenue from operations shows the core business, and "other income" should not be a large share of profit. EBITDA margin shows operating efficiency. Net profit (PAT) is the bottom line. Then divide profit by revenue for each year, because the direction of the margin matters more than the absolute rupees.
| (₹ crore) | FY22 | FY23 | FY24 |
|---|---|---|---|
| Hyundai Motor India: revenue | 47,378 | 60,307 | 69,829 |
| Hyundai Motor India: net profit | 2,901 | 4,709 | 6,060 |
| Hyundai net margin | 6.1% | 7.8% | 8.7% |
| Ola Electric: revenue | n/a | 2,631 | 5,010 |
| Ola Electric: net loss | n/a | (1,472) | (1,584) |
| Ola net margin | n/a | (56%) | (32%) |
Margins are calculated from the figures above. Hyundai's profit grew faster than revenue, which is what healthy operating leverage looks like. Ola's revenue nearly doubled, yet the absolute loss still rose about 7.6%, even though the loss shrank as a share of sales. Priya notices the same split in her own company: revenue is up, but nearly all of the profit growth comes from a one-time gain listed under other income.
Practical Tips
Step 3: Balance Sheet — Debt, Receivables, Net Worth
The balance sheet shows what the company owns and owes at one date. Look at borrowings against net worth, trade receivables against revenue (rising receivables can mean customers are not paying), inventory build-up, and contingent liabilities in the notes.
Direction matters here too. Ola Electric moved from a net cash position in FY22 to net debt by FY24, according to Business Standard's reading of its RHP, which is what sustained cash burn does to a balance sheet. Also read the "Objects of the Issue". Hyundai's IPO was entirely an offer for sale, so none of the proceeds reached the company, while most of Ola's fresh issue was meant to fund capacity and repay debt.
Step 4: Cash Flow — Where Profit Meets Reality
Profit is an opinion; cash is a fact. The cash flow statement has three parts. Operating cash flow should broadly track profit over several years. Investing cash flow shows capex and investments. Financing cash flow shows borrowing, repayment and dividends. Subtract capex from operating cash flow to get free cash flow, then ask whether the company funds itself or depends on IPO money.
Ola showed the extreme case: a free cash flow loss of about 31% of revenue in FY24, per Business Standard. Priya's company is subtler. Profit rose, but operating cash flow was weak and receivables had grown faster than sales, so some of that profit existed only on paper.
| Statement | Ask this | Warning sign |
|---|---|---|
| Profit and loss | Is growth steady and margin stable? | Profit driven by other income |
| Balance sheet | Is debt manageable? | Receivables outpacing sales |
| Cash flow | Does profit become cash? | Operating cash flow below profit for years |
| Notes | What is hidden? | Auditor qualifications, large related-party deals |
Practical Tips
Step 5: Read the Notes and the Fine Print
Most problems are disclosed in plain sight, but in the notes. Look for the restatement adjustments (how far restated profit differs from originally reported profit), any auditor qualification or emphasis of matter, related-party transactions, contingent liabilities and changes in accounting policy. A large gap between originally reported and restated profit deserves an explanation before you bid.
Priya read the notes and found two related-party loans and a one-time gain. She did not apply, and she will check the price after listing instead. That is her decision for her situation, not a recommendation.
KEY TAKEAWAYS
(1) Read the Restated Consolidated Financial Information, three years plus any stub period. (2) On the P&L, compare margins across years, not just revenue. (3) On the balance sheet, watch debt, receivables and net cash versus net debt. (4) Operating cash flow should broadly follow profit over time. (5) Read the notes for restatements, qualifications and related-party deals. (6) Financials show quality, not listing price. Next step: open your next RHP and spend ten minutes on three numbers only: margin trend, operating cash flow and debt.