GMP & Grey Market 3 min read

Where to Track IPO GMP: Best Sources Compared

K

Krisha Doshi

Published on Aug 14, 2026
Share
Best Source to Track GMP

Index

Two Ways to Track IPO GMP

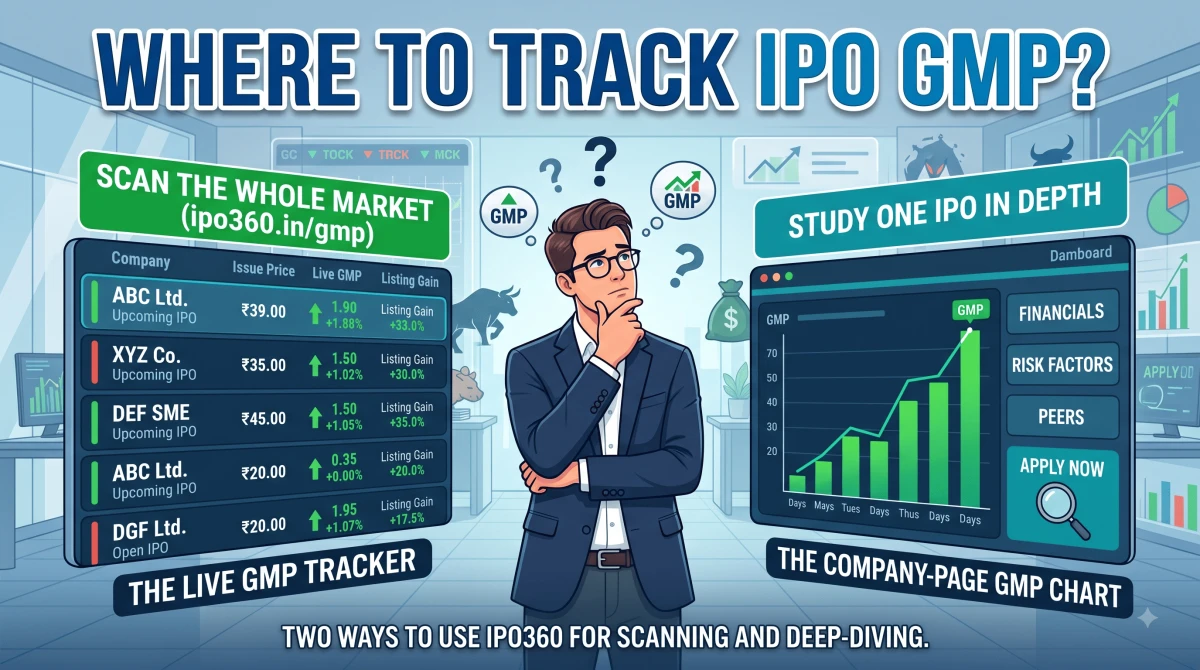
Grey Market Premium moves almost every day an IPO is open. A source that shows only today's frozen figure, with no history and no context, leaves you guessing about the direction that actually matters. IPO360 gives you two purpose-built ways to track GMP: one for scanning the whole market, one for studying a single IPO in depth.

Practical Tips

Use the Live GMP Tracker (ipo360.in/gmp) to scan GMP and expected listing gain for every open and upcoming IPO in one table. Use the company-page GMP chart to study one IPO's day-by-day trend, right next to its financials and risk factors.

The Live GMP Tracker

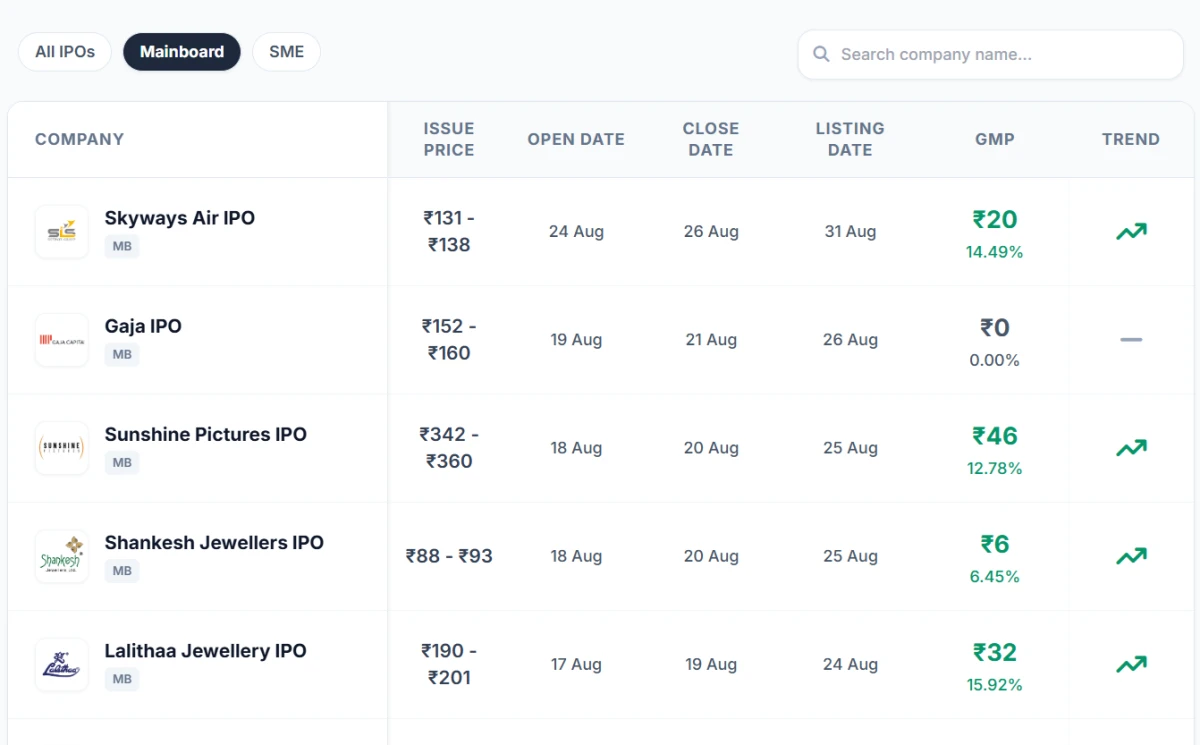
The Live GMP Tracker lists every ongoing and upcoming Mainboard and SME IPO in one table: company, issue price, dates, live GMP, and the expected listing gain percentage calculated for you. That percentage column is the key feature. It converts each rupee premium into a listing gain against the issue price, so IPOs with very different price bands become directly comparable. Filters for All, Mainboard and SME plus a name search let you narrow a crowded week down fast.
Blog Image

Practical Tips

Expected Listing Gain % = (GMP ÷ Issue Price) × 100. A ₹19 GMP on a ₹138 issue price gives an expected listing price of about ₹157, or roughly 13.77 percent. The tracker runs this for every row automatically.

Source 2: The Company-Page GMP Chart

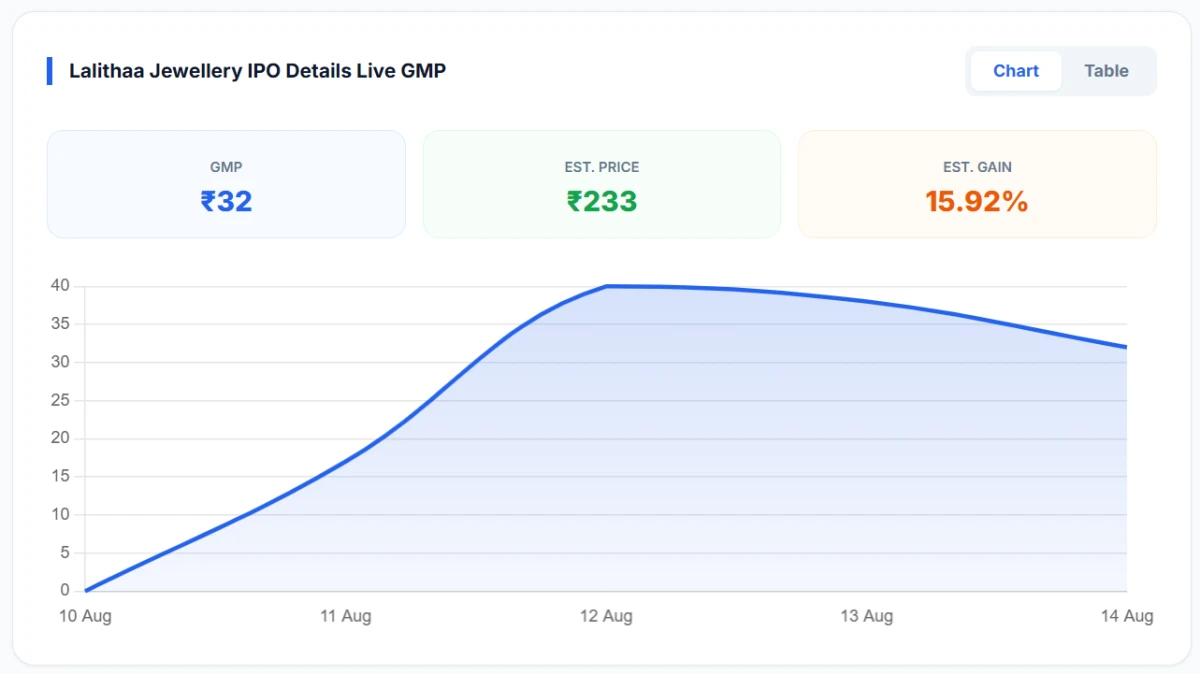
Once you have a shortlist, the company page is where you go deeper. Every IPO has its own GMP section with a live premium reading plus two tabs: a Chart that plots the day-by-day trend, and a Table with the exact dated figures. This trend view is the whole point, since a rising premium into the close tells a very different story from a fading one, even at the same number. Crucially, this GMP sits alongside the price band, financials, peers and risk factors, so you can check the grey market's enthusiasm against the actual business.
Blog Image

Which to Use, and When

Live GMP TrackerCompany-Page GMP Chart
ScopeEvery open & upcoming IPOOne specific IPO
Best forScanning & shortlistingDeep-diving one issue
GMP viewLive figure + expected gainDay-by-day chart & table
ContextFormula & definitionFull financials, risks, peers
Use itStart of researchBefore you apply

Start on the tracker to see the whole market and shortlist two or three IPOs. Then open each company page to read the GMP trend against the financials before deciding to apply.

Practical Tips

GMP is an unofficial sentiment indicator, unregulated by SEBI, and actual listing prices can differ significantly. A flat ₹0 GMP is a real signal, not an error. Treat GMP as one input among many, always read it against the financials, and never apply on GMP alone.

Practical Tips

IPO360 offers two GMP tools for two jobs. The Live GMP Tracker scans every open IPO with pre-calculated expected gain, ideal for shortlisting. The company-page GMP chart shows one IPO's day-by-day trend next to its financials and risks, ideal for deciding. A zero GMP is a genuine signal. And across both, GMP stays an unofficial indicator, never the sole reason to apply.
Category: GMP & Grey Market

Frequently Asked Questions

Q: Where can I track live IPO GMP on IPO360?
A: Two places. The Live GMP Tracker at ipo360.in/gmp shows GMP and expected listing gain for every open and upcoming Mainboard and SME IPO in one table. Each company page also has an in-page GMP section with a day-by-day chart and history table, sitting next to that IPO's financials and risk factors.
Q: What is the difference between the two GMP sources?
A: The tracker is built for scanning the whole market and shortlisting, with a ready-made expected gain percentage per IPO. The company-page chart is built for depth, showing one IPO's premium day by day next to its price band, financials and risks. Use the tracker to shortlist, the company page to decide.
Q: Does the tracker calculate the expected listing gain for me?
A: Yes. Every row converts the rupee GMP into an expected gain using (GMP ÷ Issue Price) × 100, letting you compare IPOs with very different price bands on the same footing without doing the maths yourself.
Q: Why does the company page show a GMP chart instead of just a number?
A: Because a single figure hides the trend. The chart plots the premium day by day across the bidding window, so you can see whether sentiment is building or fading. Two IPOs can show the same number yet tell very different stories once you view the movement.
Q: What does a ₹0 or 0.00% GMP mean?
A: It means the grey market is currently assigning no premium to that IPO. This is not an error but a genuine signal of weak or absent demand. IPO360 shows flat readings as plainly as strong ones, so you can factor weak sentiment in before applying.
Q: Is the GMP shown on IPO360 official or guaranteed?
A: No. GMP is unofficial, unregulated by SEBI, and operates outside the formal market. Both IPO360 locations show it purely as sentiment data. Actual listing prices can differ significantly, so GMP should be one input among many, never the sole basis for an application.

Notification Alerts

Notifications Disabled

Allow Notifications

Select Notification Channels
Join Telegram Alerts
100% Free (Limited Time)

Never Miss an IPO.

AI-Bot Driven: Lightning fast alerts.

Daily Alert Schedule

9:00 AM — IPO Calendar

Schedules for open, close, listing & allotments.

10:00 AM — Listing Updates

Live updates on IPOs listing during the day.

11:00 AM — Opening Alerts

Instant alerts for IPOs opening today.

2:00 PM — Closing Alerts

Final reminders for IPOs closing today.

REAL-TIME — Allotments & Launches

As and when out, instantly delivered.

Plus much more...
NO SPAM. NO ADS. ONLY GENUINE CONTENT.
Join Free Telegram Channel