Index
Index
IPO Analysis · Part 11 of 13
Priya, a first-time IPO applicant (an illustrative investor, not a real person), is comparing two companies on her screen. Company A shows a debt to equity ratio of 1.2. Company B shows 0.3. Her instinct says B is the safer bet, and she is ready to move on.
She might be right. She might also be about to skip the better business. The ratio is one of the most quoted numbers in any IPO review, and one of the most misread. It tells you how the company funds itself, not whether it funds itself wisely. This guide shows how to read it properly, using three real IPOs that tell three very different stories.
Practical Tips
How the ratio works, and the version that matters
Equity is what the owners have put in, including retained profits. Debt is what lenders have put in. A ratio of 0.5 means the company owes ₹50 of borrowings for every ₹100 of equity. A ratio of 2 means it owes ₹200.
Two versions appear in offer documents. The plain ratio uses gross borrowings. Net debt to equity subtracts cash and bank balances first, so a company sitting on large cash looks less stretched. Retail investors should read both, because a company can look leveraged on one and comfortable on the other.
| Ratio | What goes on top | Best used when |
|---|---|---|
| Debt to equity | Total borrowings | Quick comparison across peers |
| Net debt to equity | Borrowings minus cash | Cash-rich or cash-poor companies |
Practical Tips
Three IPOs, three debt stories
The same number can mean very different things. These three 2024 IPOs show why.
| IPO | Debt to equity | What it tells us |
|---|---|---|
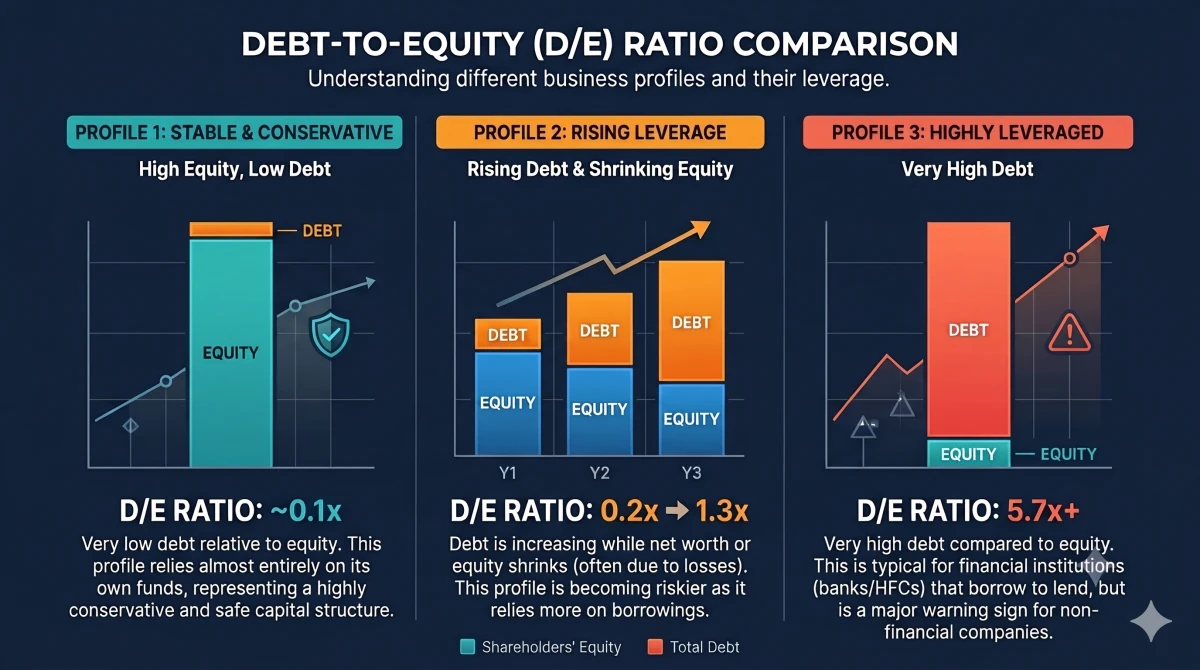
| Ola Electric (Aug 2024) | 0.2 (FY22), 0.7 (FY23), 1.3 (FY24) | Debt rising while losses shrank net worth |
| Hyundai Motor India (Oct 2024) | About 0.1 in each of FY22 to FY24 | Very low debt, and the issue was entirely an offer for sale |
| Bajaj Housing Finance (Sep 2024) | 5.7 at the time of the IPO | High, but normal for a lender |
Ola Electric is the cautionary case. Its borrowings grew from ₹804 crore in FY22 to ₹2,711 crore in FY24, while net worth fell from ₹3,661 crore to ₹2,019 crore. The ratio rose from both ends: more debt on top, less equity at the bottom. The company had never reported a profit, and the objects of the issue included repaying debt.
Hyundai sits at the other end. With borrowings of about ₹833 crore against net worth of about ₹10,666 crore in FY24, debt was a rounding error. But the ₹27,870 crore issue was entirely an offer for sale, so none of the money reached the company.
Bajaj Housing Finance looks alarming at 5.7 until you remember what it does. A housing finance company borrows to lend. Judge it on capital adequacy (21.2% at the time of the IPO) and asset quality, not on the raw ratio.
Myth vs reality: "The IPO will fix the debt"
Reality: only the fresh issue portion can reduce company debt, and only if the objects of the issue say so. Anupam Rasayan's ₹760 crore IPO in 2021 earmarked ₹564 crore for debt repayment, and the company later confirmed it had repaid ₹470.73 crore of borrowings from the proceeds by 31 March 2021. More recently, Manipal Health reported repaying ₹5,310 crore of NCDs from its IPO, against a planned ₹5,552.76 crore, on consolidated debt of ₹11,185.02 crore as of May 2026. Those are real deleveraging stories.
An offer for sale like Hyundai's does nothing for the balance sheet. Selling shareholders take the cash.
Practical Tips
A five-minute debt check before you apply
Open the RHP and go through five questions in order.
First, check the three-year trend, not a single year. Ola's 0.2 to 1.3 climb tells you more than any one figure. Second, ask why equity moved. Falling net worth from accumulated losses is a very different signal from planned dividends or buybacks. Third, compare the ratio with listed peers in the same sector, never across sectors. Fourth, read the objects of the issue and calculate the post-IPO ratio yourself, adding the fresh issue to equity and subtracting any debt repaid. Fifth, check whether the company can actually service its debt, using interest coverage and operating cash flow.
A low ratio with negative cash flow can be riskier than a high ratio with strong, steady earnings. Debt is not the enemy; debt the business cannot service is.
Back to Priya
Priya reads both RHPs. Company A's 1.2 comes from a factory expansion funded by loans, and roughly a third of its fresh issue is earmarked to repay them, taking her own calculation of the post-IPO ratio near 0.6. Its interest coverage is healthy. Company B's 0.3 looks lovely, but its operating cash flow is negative and its equity has been shrinking.
She does not decide on the ratio alone. She notes it, moves on to valuation, and adds a red-flag check before applying. That last step is where debt should sit: one input among several, never a verdict.
KEY TAKEAWAYS
The debt to equity ratio is borrowings divided by equity, and net debt to equity subtracts cash first. Below 1 is a comfortable rule of thumb for non-financial companies, but lenders like Bajaj Housing Finance run much higher by design. Always read the three-year trend and ask why equity moved, as Ola Electric's shrinking net worth shows. Only the fresh issue portion can reduce debt, so an offer for sale like Hyundai's leaves the balance sheet unchanged. Recompute the post-IPO ratio from the objects of the issue instead of trusting the pre-IPO figure. Finally, test whether the company can service its debt, because affordability matters more than the ratio itself.