Index
Index
IPO Analysis · Part 4 of 13
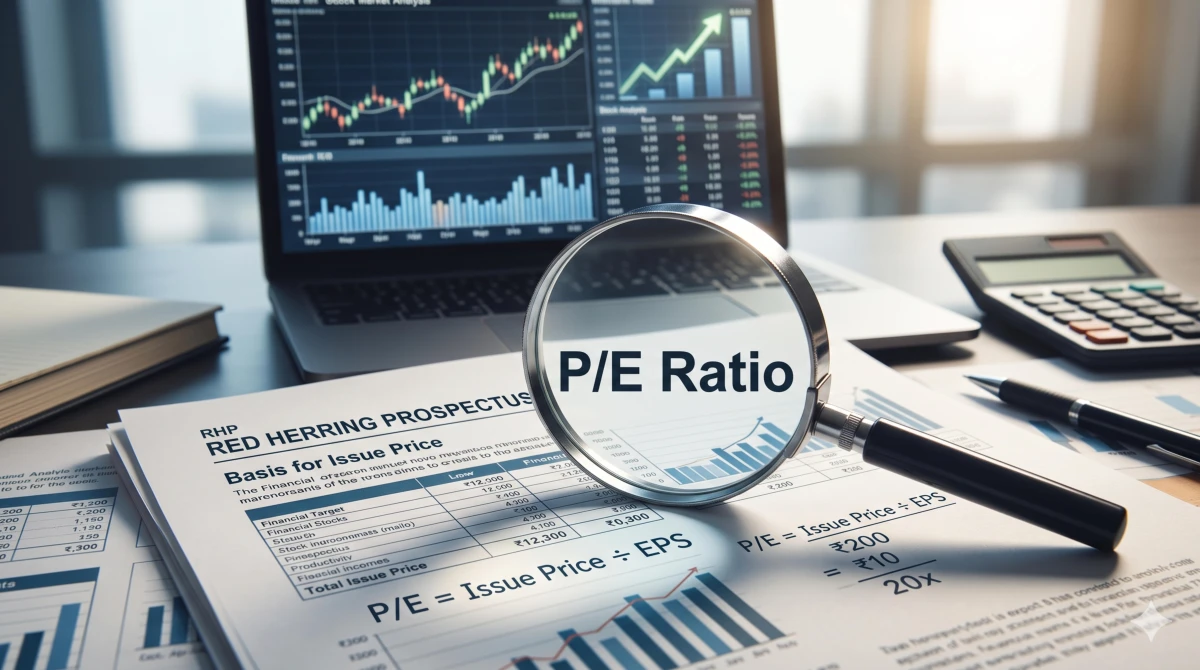
Priya is looking at an IPO priced at ₹200 a share. The company earned ₹10 per share last year, so she works out a P/E of 20x. Listed companies in the same sector trade at about 30x. "Cheap," she thinks, and reaches for the bid form.
Hold that thought. P/E is the fastest valuation check an IPO investor has, and one of the easiest to misuse. The number is only as honest as the earnings behind it, and an IPO prospectus offers several versions of those earnings. This guide shows how to calculate P/E correctly, which comparison actually matters, and what Priya should have checked before trusting her 20x.
Practical Tips
What the P/E Ratio Tells You in an IPO
P/E turns a share price into a payback-style number. At 25x, you pay ₹25 for each ₹1 of annual profit, so the company would need 25 years of today's earnings to "repay" your price. Investors accept higher multiples when they expect profits to grow quickly, and demand lower ones when growth looks slow or risky.
In a listed stock, the market sets the price and you work out the P/E. In a book-built IPO the logic is reversed. The company and its lead managers (BRLMs) choose a price band first, and the P/E is simply the result of that choice. That is why P/E matters even more in IPOs. It shows how aggressively the sellers have priced the issue before trading begins.
Practical Tips
P/E in Real IPOs: Four Issues, Four Stories
The table shows how P/E looked at the upper price band for four well-known IPOs.
| IPO | Upper band | Earnings basis | P/E at upper band | What stood out |
|---|---|---|---|---|
| Tata Technologies (Nov 2023) | ₹500 | FY23 EPS ₹15.38 | 32.5x | Peers KPIT ~105x and Tata Elxsi ~70x (FY23) |
| Hyundai Motor India (Oct 2024) | ₹1,960 | FY24 EPS ₹74.58 | 26.3x | Maruti ~29.4x and M&M ~30.0x per one broker; issue was 100% OFS |
| Bajaj Housing Finance (Sep 2024) | ₹70 | FY24 EPS ₹2.60 | ~26.9x (~33x in another analysis) | Peer median ~24x in that analysis |
| Ola Electric (Aug 2024) | ₹76 | Loss-making (FY24 net loss ₹1,584 crore) | Not meaningful | EV/sales of 7.2x on FY24 (Geojit) |
Notice what the table does and does not show. Tata Technologies was priced at a steep discount to its listed peers and became a multibagger. Hyundai was priced roughly in line with Maruti and M&M and still had a weak listing. Bajaj Housing looked expensive against housing-finance peers and listed with a 114% gain. Ola Electric had no P/E at all, so analysts fell back on revenue multiples. The Bajaj row also shows that the same IPO can carry two different P/Es depending on which earnings figure is used.
Three Traps That Distort an IPO's P/E
Most bad P/E readings come from the earnings figure, not the price.
| Trap | What goes wrong | What to check |
|---|---|---|
| Pre-issue vs post-issue EPS | A fresh issue adds new shares, which lowers EPS and raises the real P/E. An OFS-only issue like Hyundai's adds no shares. | Use post-issue EPS from the RHP |
| One-time profits | An asset sale, tax write-back or exceptional gain inflates EPS for one year. | Look at restated EPS and exceptional items |
| Stale or peak earnings | A year-old EPS in a fast-growing business, or a cyclical company at peak profits, flatters the multiple. | Check the latest period and a 3-year trend |
Companies with no profit need a different yardstick. Loss-making firms such as Ola Electric are usually judged on EV/sales, and banks and NBFCs are often judged on price-to-book (P/B) alongside P/E.
How to Compare P/E With Peers Properly
Pick three to five listed companies with a similar business model, size and growth profile. The RHP's "Basis for Issue Price" section already lists peers and their P/E, but it is chosen by the issuer, so build your own list as well. Use the same earnings basis for every company, either the latest full year or trailing twelve months, and compare against the peer median rather than a single flattering name.
Myth: A low P/E means the IPO is a bargain.
Reality: A low P/E can signal slow growth, heavy debt or peak-cycle profits. A high P/E can be justified if earnings are compounding quickly. A P/E ratio is a price tag, not a verdict.
Back to Priya: What She Found
Priya opens the RHP before bidding. The ₹10 EPS includes a ₹2 one-time gain from selling an asset, so adjusted EPS is ₹8. The company is also issuing fresh shares that raise the share count by 25%, which brings post-issue EPS down to ₹6.40. Her real P/E is ₹200 ÷ ₹6.40, about 31x, slightly above the 30x sector average.
The IPO is not cheap after all. It is priced in line with peers, so it needs to win on growth, margins and debt, not on valuation. (Priya and her figures are illustrative.)
KEY TAKEAWAYS
- P/E is the issue price divided by EPS, or post-issue market cap divided by PAT, calculated at the upper band.
- In an IPO, P/E reflects the seller's pricing choice, so check it before the market does.
- Always use post-issue, restated EPS. Fresh issues dilute EPS and one-off gains inflate it.
- Compare against three to five similar listed peers on the same earnings basis, using the median.
- Tata Technologies, Hyundai, Bajaj Housing and Ola Electric show that P/E alone did not predict listing outcomes.
- For loss-making companies and financials, add EV/sales or P/B instead of relying on P/E.