- Executive Overview
CleanMax, founded in 2010, is India’s largest commercial and industrial (C&I) renewable energy provider, focused on helping companies achieve Net Zero goals. It supplies green power and energy solutions to sectors like data centers, manufacturing, and infrastructure through customized corporate contracts, allowing better pricing and tailored services compared to traditional power developers.
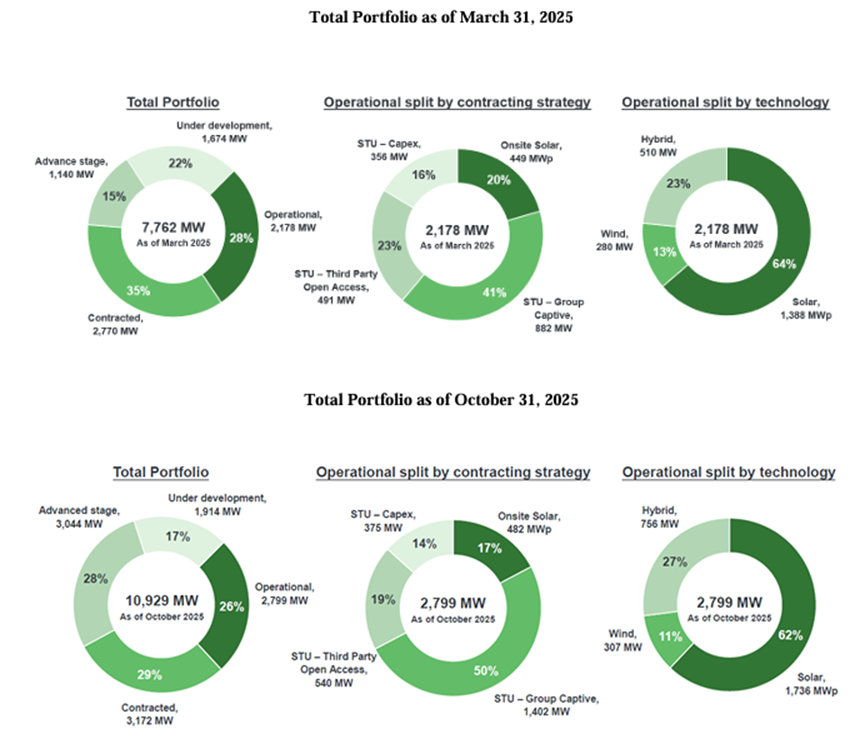
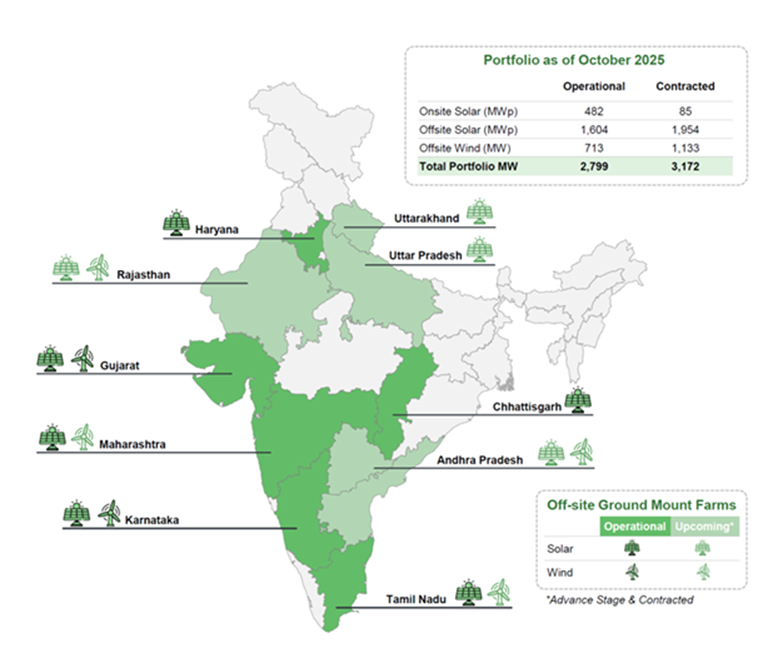
The company operates at a large scale with 2.80 GW of installed capacity and 3.17 GW of projects under execution as of October 2025, with presence across 23 Indian states and international markets like UAE and Thailand. CleanMax stands out due to its end-to-end capabilities, strong customer retention (~72% repeat business), and backing from global investors like Brookfield, enabling efficient growth and strong market positioning.
2. Business Model and Revenue Streams
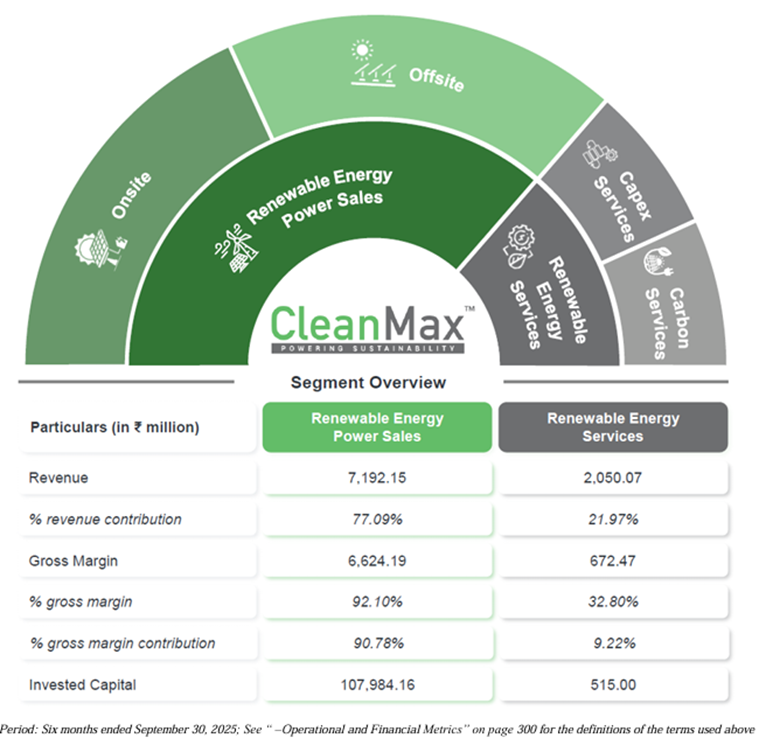
- Power Sales (Core Revenue): Around 77% of revenue comes from selling renewable power through long-term PPAs and EAPAs, ensuring stable and high-margin cash flows.
- Energy Services: ~22% of revenue comes from EPC, O&M services, and carbon credit trading, which also helps generate upfront cash for the business.
- Captive Model (Cost Advantage): Clients invest ~26% in projects and consume most of the power, helping them save 25–40% on electricity while reducing CleanMax’s capital needs.
- Long-Term Contracts: Strong contract visibility with ~23-year average PPA tenure and ~17-year lock-in period.
- Premium Pricing: Focus on corporate clients (not government tenders) allows higher tariffs (~₹4.28/unit vs ~₹2.4 industry average).
Client Concentration and Risk Management
- Diversified Revenue Base: As of September 30, 2025, no single client contributed more than 10% of revenue, mitigating concentration risk.
- High-Grade Counterparties: 94.72% of customers carry a credit rating of 'A-' or above, or are multinational subsidiaries, effectively neutralizing counterparty default risk.
- Industry-Leading Collections: This superior credit profile results in an exceptionally low Days Sales Outstanding (Receivable Days) of just 24 days for power sales in H1 FY26 (versus an industry average of 71.66 days).
Financial and Segment Performance Overview
| Segment Financials (₹ in millions) | Six Months Ended Sep 30, 2025 | Fiscal 2025 | Fiscal 2024 | Fiscal 2023 |
|---|---|---|---|---|
| Total Revenue from Operations | 9,329.53 | 14,957.01 | 13,898.37 | 9,295.82 |
| Renewable Energy Power Sales Revenue | 7,192.15 | 11,072.48 | 8,663.33 | 4,748.15 |
| Power Sales Gross Margin % | 92.10% | 92.56% | 93.36% | 93.48% |
| Renewable Energy Services Revenue | 2,050.07 | 3,766.53 | 5,180.04 | 4,547.67 |
| Services Gross Margin % | 32.80% | 16.17% | 25.11% | 12.88% |
| Adjusted EBITDA (Consolidated) | 6,700.68 | 10,093.31 | 7,722.36 | 4,245.97 |
3. Products and Service Portfolio
CleanMax tailors its product mix to fit the geographical and regulatory constraints of varied corporate consumers, leaning heavily on multi-technology generation (Solar, Wind, Hybrid).
Key Product Lines
- Onsite Solar: Solar plants installed at customer locations (rooftops, land), used as an entry point for new clients (~17% capacity).
- Offsite STU Farms: Large solar/wind projects connected to state grids, allowing clients to use power with monthly adjustments.
- Offsite CTU Farms: National grid-connected projects enabling pan-India supply; a fast-growing segment with large corporate clients.
- Turnkey Capex Services: Complete project development (EPC & O&M) where clients own the asset while CleanMax manages execution.
- Key Operational Data & Utilization Metrics
- Execution excellence and asset efficiency are critical to the underlying equity returns. CleanMax maintains world-class uptime and robust load factors.
| Operational KPIs | Six Months Ended Sep 30, 2025 | Fiscal 2025 | Fiscal 2024 |
|---|---|---|---|
| Total Generation Exported (Mn units) | 1,319.16 | 2,615.92 | 1,932.68 |
| Average Grid Availability (Offsite) | 99.08% | 99.10% | 99.26% |
| Average Plant Availability (Portfolio) | 98.04% | 98.17% | 98.19% |
| Plant Load Factor - Offsite Solar (AC) | 23.23% | 24.65% | 23.06% |
| Plant Load Factor - Wind | 34.86% | 31.60% | 34.52% |
| Plant Load Factor - Hybrid | 46.60% | 45.90% | 39.18% |
4. Key Business Strengths
- Market Leader: Largest C&I renewable player in India with 500+ corporate clients and strong market share.
- Stable Revenue Base: Long-term contracts (~23 years), high repeat customers (~72%), and strong client credit quality.
- High Returns & Efficiency: Strong project returns (~35% ROE) with efficient capital structure.
- Execution Strength: End-to-end in-house capabilities ensure timely and cost-effective project delivery.
- Premium Pricing: Focus on corporate clients allows higher tariffs than industry averages.
5. Future Growth Strategy
- Battery Storage (BESS): Add energy storage to provide reliable 24/7 green power.
- Carbon Market Expansion: Grow carbon credit and I-REC trading business.
- CTU Network Growth: Expand national grid projects for pan-India corporate supply.
- Service Expansion: Increase high-margin EPC and O&M services, including wind segment.
- Strategic Partnerships: Collaborate with global companies to scale with lower capital investment.


Delete Comment?
Are you sure you want to delete this comment? This action cannot be undone.
Discussion
Join the discussion!
Log In to CommentNo comments yet. Be the first to share your thoughts!